
3-5-7 Rule Position Size Calculator
Enter your account details and trade parameters to calculate the maximum safe position size and verify compliance with the 3% single-trade, 5% total-risk, and 7% sector-exposure rules.
| Total Cost of Position: | $0.00 |
| Risk Per Share: | $0.00 |
| Total Dollar Risk: | $0.00 |
You stare at your screen, heart pounding. You just entered a trade on AAPL because it looked like it was about to break out. But two minutes later, it’s down 2%. Panic sets in. Do you cut losses? Do you hold and hope? This emotional rollercoaster is exactly why most retail traders fail. They don’t have a system for handling uncertainty. That’s where the 3-5-7 Rule comes in. It’s not some complex algorithm from Wall Street quants. It’s a simple, heuristic framework designed to keep your capital safe when the market goes sideways.
Think of the 3-5-7 rule as your personal safety net. It helps you decide three critical things before you even click "buy": how much money to risk per trade, how many positions to hold simultaneously, and what percentage of your total portfolio should be exposed to any single asset class. If you’re tired of guessing and want a structured approach to stock market tips, this guide breaks down exactly how to apply these numbers to your own account.
Decoding the Numbers: What Do 3, 5, and 7 Actually Mean?
Let’s strip away the jargon. The 3-5-7 rule isn’t a rigid law of physics; it’s a guideline for risk management. Here is the breakdown:
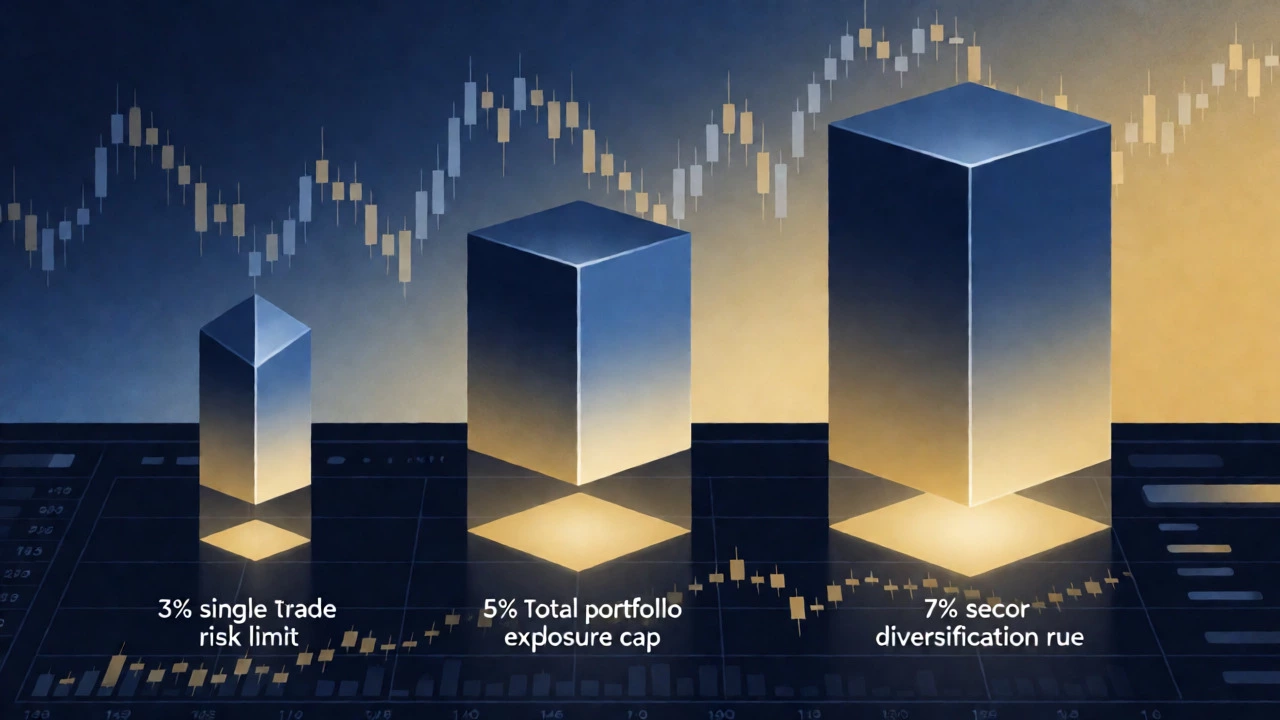
- The 3% Rule (Risk Per Trade): Never risk more than 3% of your total trading capital on a single trade. If you have $10,000 in your account, you shouldn’t lose more than $300 if the trade hits its stop-loss.
- The 5% Rule (Total Portfolio Risk): Your total open risk across all active positions should never exceed 5% of your capital. This prevents a bad day in the market from wiping out a significant chunk of your account.
- The 7% Rule (Asset Class Exposure): No single sector or asset class should make up more than 7% of your total portfolio value. This diversifies your exposure so that a crash in tech doesn’t ruin your entire week.
Why these specific numbers? They strike a balance between aggression and survival. In professional circles, risking 1% is common, but for smaller accounts, 1% might feel too slow to generate meaningful returns. Three percent gives you enough bite to grow while keeping the tail risk manageable. Five percent total exposure ensures you aren’t over-leveraged during volatile sessions, such as earnings season or Fed announcements. Seven percent caps concentration, forcing you to look outside your comfort zone.
Step-by-Step: How to Calculate Position Size Using the 3% Rule
Most beginners get this wrong. They think "risking 3%" means buying 3% worth of stock. It doesn’t. It means calculating the size of the trade based on where your stop-loss is. Let’s walk through a real-world example using Tesla (TSLA).
Imagine you have a $20,000 trading account. According to the 3% rule, your maximum loss on this trade is $600 ($20,000 x 0.03). You see TSLA trading at $250. You analyze the chart and determine that if it drops below $245, your thesis is invalid. So, your stop-loss is at $245.
- Determine Risk Amount: $600 (3% of $20k).
- Determine Price Distance: Entry $250 - Stop $245 = $5 risk per share.
- Calculate Shares: $600 / $5 = 120 shares.
You buy 120 shares. The total cost is $30,000 ($250 x 120), which is more than your account size due to leverage or cash availability, but your *risk* is strictly capped at $600. If you had just bought $600 worth of stock (about 2.4 shares), you’d need massive price moves to make money. If you bought $20,000 worth without a stop, one bad move could wipe you out. The 3% rule bridges that gap by linking position size to volatility.
Managing Multiple Positions with the 5% Limit
Here is where discipline kicks in. You’ve opened the TSLA trade risking $600. Now you spot a setup in NVIDIA (NVDA). Can you take it? Not necessarily. You need to check your total open risk.
Your cap is 5% of $20,000, which is $1,000. Since you are already risking $600 on TSLA, you only have $400 left to risk on new trades. If you want to enter NVDA, you must calculate a position size that risks no more than $400. Maybe you set a tighter stop-loss or reduce the number of shares.
This constraint forces you to prioritize high-quality setups. When your risk budget is full, you can’t jump into every shiny object. You wait. You watch. And often, the best trades come to those who wait. This is the psychological benefit of the trading strategy: it removes FOMO (Fear Of Missing Out) because you physically cannot take another trade until one closes or adjusts.
Portfolio Diversification: The 7% Sector Cap
Trading isn’t just about individual stocks; it’s about correlation. If you buy Apple, Microsoft, and Amazon, you might think you’re diversified. But if they are all tech giants, they often move together. If the Nasdaq drops 2%, all three likely drop 2%. You haven’t diversified; you’ve tripled your bet on one outcome.
The 7% rule limits your exposure to any single sector. If your portfolio is $50,000, no single sector (e.g., Technology, Energy, Healthcare) should hold more than $3,500 in open positions. This encourages you to look at uncorrelated assets. Maybe you pair a tech stock with an energy ETF or a defensive utility stock. By capping sector exposure, you smooth out equity curves. You won’t have explosive gains in a tech bubble, but you also won’t suffer catastrophic drawdowns when that bubble bursts.
| Rule Component | Calculation | Max Value ($) | Actionable Insight |
|---|---|---|---|
| 3% Single Trade Risk | $10,000 x 0.03 | $300 | Set stop-losses so max loss equals $300. |
| 5% Total Open Risk | $10,000 x 0.05 | $500 | If holding 2 trades, split risk (e.g., $250 each). |
| 7% Sector Exposure | $10,000 x 0.07 | $700 | Don't put >$700 in Tech, Energy, etc. |
Common Mistakes Traders Make with the 3-5-7 Rule
It looks simple on paper, but execution is where people stumble. The first mistake is ignoring the stop-loss placement. If you pick an arbitrary stop-loss just to fit the math, you’re setting yourself up for failure. The stop must be technical-based on support levels, moving averages, or volatility indicators-not just a dollar amount. If the technical stop requires risking 5% instead of 3%, skip the trade or reduce position size further. Don’t widen the stop to fit the rule; adjust the position size to fit the stop.
Another pitfall is treating the 7% rule as a hard ceiling for long-term investing versus short-term trading. For swing traders holding positions for weeks, 7% might be too restrictive. However, for day traders or short-term swing traders, it’s vital. Adjust the percentage based on your timeframe. If you hold for months, maybe 10-15% per sector is acceptable. If you hold for days, stick to 7% or lower.
Finally, many traders forget to recalculate after wins and losses. Your account balance changes daily. If you blow up to $9,000, your 3% risk is now $270, not $300. If you grow to $11,000, your risk capacity increases to $330. Automate this calculation in your spreadsheet or trading platform. Static numbers lead to dynamic errors.

Adapting the Rule for Different Market Conditions
Markets change. Volatility spikes during geopolitical events or economic data releases. During calm periods, a tight stop-loss works fine. During high-volatility periods, prices whip around, triggering stops prematurely. Should you abandon the rule? No. Adapt it.
In high-volatility environments, consider reducing your risk per trade from 3% to 1.5% or 2%. This allows you to use wider stops (to avoid noise) while keeping the dollar risk low. Conversely, in trending, low-volatility markets, you might push closer to the 3% limit because the probability of hitting your stop decreases. The 3-5-7 rule is a baseline, not a straitjacket. Use it as a starting point, then tweak based on the Average True Range (ATR) of the assets you trade.
Also, consider your experience level. New traders should start with half the recommended limits: 1.5% per trade, 2.5% total risk, and 5% sector exposure. Prove you can execute the plan consistently before scaling up. Confidence comes from competence, not from big bets.
Frequently Asked Questions
Is the 3-5-7 rule suitable for options trading?
Yes, but with caution. Options have non-linear risk profiles. Instead of calculating shares, calculate the premium paid plus potential additional costs. Ensure the total premium at risk does not exceed 3% of your account. Be aware that theta decay and volatility crush can affect value rapidly, so strict stop-losses are harder to implement. Many options traders use a stricter 1-2% rule initially.
Can I ignore the 7% sector rule if I'm highly confident in a stock?
Confidence is often biased. Even if you are right about the company, sector-wide news (like regulatory changes or interest rate hikes) can drag the whole group down. Ignoring the sector cap exposes you to systemic risk. Stick to the rule unless you have a hedging strategy in place for that specific sector.
What happens if I have multiple correlated stocks in different sectors?
Correlation matters more than labels. If you hold a tech stock and a semiconductor stock, they are highly correlated. Treat them as part of the same risk bucket. Check historical correlation matrices. If two stocks move together 80% of the time, combine their exposure against the 7% limit, regardless of their official sector classification.
Does this rule apply to crypto trading?
Absolutely. Crypto is far more volatile than stocks. You might need to lower the 3% risk to 1% or 0.5% because 5% moves happen in minutes. The 5% total risk cap is crucial here because crypto markets can gap down overnight. Diversification via the 7% rule is tricky since most altcoins correlate with Bitcoin, so treat major coins as a single high-risk asset class.
How do I track my open risk in real-time?
Use a trading journal or a spreadsheet that calculates (Entry Price - Stop Loss) x Quantity for each open position. Sum these values to get your total open risk. Compare this sum to 5% of your current account balance. Some advanced platforms offer built-in risk calculators that display this metric directly on the order ticket.